Matplotlib으로 Radar Chart 커스터마이징 하기
Matplotlib으로 Radar Chart 커스터마이징 하기
기본적인 matplotlib radar chart
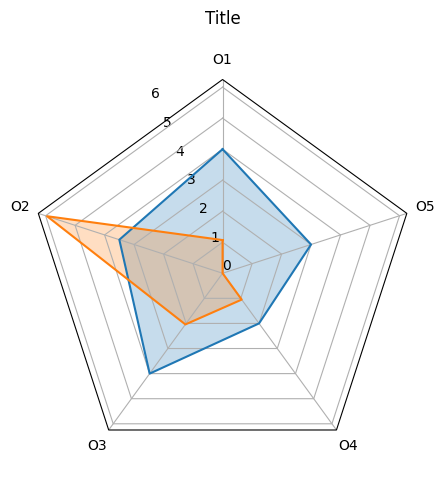
일반적인 레이더 차트는 원형의 그리드로 표시되지만, 이를 커스터마이즈하여 다각형 그리드로 바꿀 수 있다. 그리드를 다각형으로 그리고 싶었던 나와 똑같은 고민을 한 흔적을 Stack Overflow에서 찾을 수 있었다.
출처: Stack Overflow - How to make radar/spider chart with pentagon grid using matplotlib and Python
일단, 원본 코드 그대로 가져왔다.
1
2
3
4
5
6
7
8
9
10
11
12
13
14
15
16
17
18
19
20
21
22
23
24
25
26
27
28
29
30
31
32
33
34
35
36
37
38
39
40
41
42
43
44
45
46
47
48
49
50
51
52
53
54
55
56
57
58
59
60
61
62
63
64
65
66
67
68
69
70
71
72
73
74
75
76
77
78
79
80
81
82
83
84
85
86
87
88
89
90
91
92
93
94
95
96
97
98
99
100
101
102
103
104
105
106
107
108
109
110
111
112
113
114
115
116
117
118
119
120
121
122
123
124
125
126
127
128
import numpy as np
import matplotlib.pyplot as plt
from matplotlib.patches import Circle, RegularPolygon
from matplotlib.path import Path
from matplotlib.projections.polar import PolarAxes
from matplotlib.projections import register_projection
from matplotlib.spines import Spine
from matplotlib.transforms import Affine2D


def radar_factory(num_vars, frame='circle'):
    """Create a radar chart with `num_vars` axes.

    This function creates a RadarAxes projection and registers it.

    Parameters
    ----------
    num_vars : int
        Number of variables for radar chart.
    frame : {'circle' | 'polygon'}
        Shape of frame surrounding axes.

    """
    # calculate evenly-spaced axis angles
    theta = np.linspace(0, 2*np.pi, num_vars, endpoint=False)

    class RadarTransform(PolarAxes.PolarTransform):
        def transform_path_non_affine(self, path):
            # Paths with non-unit interpolation steps correspond to gridlines,
            # in which case we force interpolation (to defeat PolarTransform's
            # autoconversion to circular arcs).
            if path._interpolation_steps > 1:
                path = path.interpolated(num_vars)
            return Path(self.transform(path.vertices), path.codes)

    class RadarAxes(PolarAxes):

        name = 'radar'
        PolarTransform = RadarTransform

        def __init__(self, *args, **kwargs):
            super().__init__(*args, **kwargs)
            # rotate plot such that the first axis is at the top
            self.set_theta_zero_location('N')

        def fill(self, *args, closed=True, **kwargs):
            """Override fill so that line is closed by default"""
            return super().fill(closed=closed, *args, **kwargs)

        def plot(self, *args, **kwargs):
            """Override plot so that line is closed by default"""
            lines = super().plot(*args, **kwargs)
            for line in lines:
                self._close_line(line)

        def _close_line(self, line):
            x, y = line.get_data()
            # FIXME: markers at x[0], y[0] get doubled-up
            if x[0] != x[-1]:
                x = np.concatenate((x, [x[0]]))
                y = np.concatenate((y, [y[0]]))
                line.set_data(x, y)

        def set_varlabels(self, labels):
            self.set_thetagrids(np.degrees(theta), labels)

        def _gen_axes_patch(self):
            # The Axes patch must be centered at (0.5, 0.5) and of radius 0.5
            # in axes coordinates.
            if frame == 'circle':
                return Circle((0.5, 0.5), 0.5)
            elif frame == 'polygon':
                return RegularPolygon((0.5, 0.5), num_vars, radius=0.5, edgecolor="k")
            else:
                raise ValueError("unknown value for 'frame': %s" % frame)

        def draw(self, renderer):
            """ Draw. If frame is polygon, make gridlines polygon-shaped """
            if frame == 'polygon':
                gridlines = self.yaxis.get_gridlines()
                for gl in gridlines:
                    gl.get_path()._interpolation_steps = num_vars
            super().draw(renderer)

        def _gen_axes_spines(self):
            if frame == 'circle':
                return super()._gen_axes_spines()
            elif frame == 'polygon':
                # spine_type must be 'left'/'right'/'top'/'bottom'/'circle'.
                spine = Spine(axes=self,
                              spine_type='circle',
                              path=Path.unit_regular_polygon(num_vars))
                # unit_regular_polygon gives a polygon of radius 1 centered at
                # (0, 0) but we want a polygon of radius 0.5 centered at (0.5,
                # 0.5) in axes coordinates.
                spine.set_transform(Affine2D().scale(.5).translate(.5, .5)
                                    + self.transAxes)
                return {'polar': spine}
            else:
                raise ValueError("unknown value for 'frame': %s" % frame)

    register_projection(RadarAxes)
    return theta


data = [['O1', 'O2', 'O3', 'O4', 'O5'],
        ('Title', [
                    [4, 3.5, 4, 2, 3,],
                    [1.07, 5.95, 2.04, 1.05, 0.00,],
                  ]
        )]

N = len(data[0])
theta = radar_factory(N, frame='polygon')

spoke_labels = data.pop(0)
title, case_data = data[0]
fig, ax = plt.subplots(figsize=(5, 5), subplot_kw=dict(projection='radar'))
fig.subplots_adjust(top=0.85, bottom=0.05)
ax.set_rgrids([0, 1, 2.0, 3.0, 4.0, 5.0, 6])
ax.set_title(title,  position=(0.5, 1.1), ha='center', pad=40)

for d in case_data:
    line = ax.plot(theta, d)
    ax.fill(theta, d, alpha=0.25, label='_nolegend_')
ax.set_varlabels(spoke_labels)

plt.show()
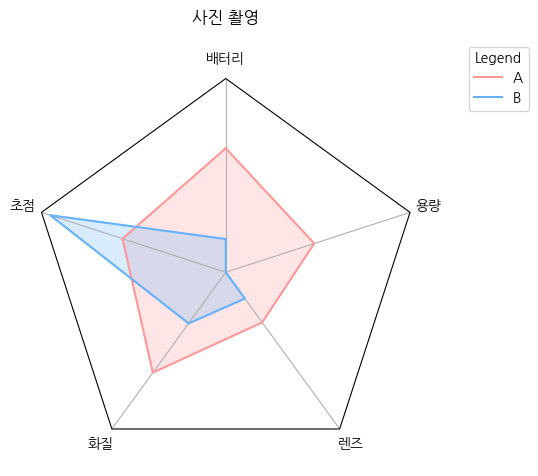
위의 베이스 코드를 이용해 색상 조정 및 한글 폰트 적용을 하였다.
한글 폰트 불러오기
한 가지 유의점은 그래프에 한글이 나오게 하려면 한글 폰트를 불러와야 한다. 폰트 경로를 설정하고 해당 폰트를 matplotlib에 적용해야한다. 나는 AWS EC2 환경에서 작업했었는데 아래와 같이 폰트를 적용해주어야 그래프에 한글이 깨지지 않는다.
1
2
3
4
5
import matplotlib.font_manager as fm
from matplotlib import rc

font_list = fm.findSystemFonts(fontpaths = None, fontext = 'ttf')
font_list[:]
이렇게 하면 사용가능한 폰트 목록이 나온다.
1
2
3
4
font_path = '/usr/share/fonts/truetype/nanum/NanumGothic.ttf'

font = fm.FontProperties(fname=font_path).get_name()
rc('font', family=font)
나는 이 중에서 나눔 고딕 폰트를 사용하였다. 이렇게 하면 한글이 깨지지 않고 잘 적용됨을 확인할 수 있다.
그리드를 다각형으로 커스터마이징한 코드
1
2
3
4
5
6
7
8
9
10
11
12
13
14
15
16
17
18
19
20
21
22
23
24
25
26
27
28
29
30
31
32
33
34
35
36
37
38
39
40
41
42
43
44
45
46
47
48
49
50
51
52
53
54
55
56
57
58
59
60
61
62
63
64
65
66
67
68
69
70
71
72
73
74
75
76
77
78
79
80
81
82
83
84
85
86
87
88
89
90
91
92
93
94
95
96
97
98
99
100
101
102
103
104
105
106
107
108
109
110
111
112
113
114
115
116
117
118
119
120
121
122
123
124
125
126
127
128
129
130
131
132
133
134
135
136
137
138
139
140
141
142
143
144
145
146
147
148
149
import numpy as np
import matplotlib.pyplot as plt
from matplotlib.patches import Circle, RegularPolygon
from matplotlib.path import Path
from matplotlib.projections.polar import PolarAxes
from matplotlib.projections import register_projection
from matplotlib.spines import Spine
from matplotlib.transforms import Affine2D

# 레이더 차트 생성 함수
def radar_factory(num_vars, frame='circle'):
    """Create a radar chart with `num_vars` axes.

    This function creates a RadarAxes projection and registers it.

    Parameters
    ----------
    num_vars : int
        Number of variables for radar chart. (레이더 차트 축 수)
    frame : {'circle' | 'polygon'}
        Shape of frame surrounding axes. (축을 둘러싼 프레임 형태)

    """
    # 축 각도 계산 (변수 개수 만큼)
    theta = np.linspace(0, 2*np.pi, num_vars, endpoint=False)

    # 레이더 차트 변환 클래스 정의
    class RadarTransform(PolarAxes.PolarTransform):
        def transform_path_non_affine(self, path):
            # Paths with non-unit interpolation steps correspond to gridlines,
            # in which case we force interpolation (to defeat PolarTransform's
            # autoconversion to circular arcs).
            if path._interpolation_steps > 1:
                path = path.interpolated(num_vars)
            return Path(self.transform(path.vertices), path.codes)

    # 레이더 차트 Axes 클래스 정의
    class RadarAxes(PolarAxes):
        name = 'radar'
        PolarTransform = RadarTransform

        def __init__(self, *args, **kwargs):
            super().__init__(*args, **kwargs)
            # rotate plot such that the first axis is at the top
            self.set_theta_zero_location('N')

        def fill(self, *args, closed=True, **kwargs):
            """Override fill so that line is closed by default"""
            return super().fill(closed=closed, *args, **kwargs)

        def plot(self, *args, **kwargs):
            """Override plot so that line is closed by default"""
            lines = super().plot(*args, **kwargs)
            for line in lines:
                self._close_line(line)

        def _close_line(self, line):
            x, y = line.get_data()
            # FIXME: markers at x[0], y[0] get doubled-up
            if x[0] != x[-1]:
                x = np.concatenate((x, [x[0]]))
                y = np.concatenate((y, [y[0]]))
                line.set_data(x, y)

        def set_varlabels(self, labels):
            self.set_thetagrids(np.degrees(theta), labels)

        def _gen_axes_patch(self):
            # The Axes patch must be centered at (0.5, 0.5) and of radius 0.5
            # in axes coordinates.
            if frame == 'circle':
                return Circle((0.5, 0.5), 0.5)
            elif frame == 'polygon':
                return RegularPolygon((0.5, 0.5), num_vars, radius=0.5, edgecolor="k")
            else:
                raise ValueError("unknown value for 'frame': %s" % frame)

        # 프레임 그리드라인 그리기
        def draw(self, renderer):
            """ Draw. If frame is polygon, make gridlines polygon-shaped """
            if frame == 'polygon':
                gridlines = self.yaxis.get_gridlines()
                for gl in gridlines:
                    gl.get_path()._interpolation_steps = num_vars
            super().draw(renderer)

        def _gen_axes_spines(self):
            if frame == 'circle':
                return super()._gen_axes_spines()
            elif frame == 'polygon':
                # spine_type must be 'left'/'right'/'top'/'bottom'/'circle'.
                spine = Spine(axes=self,
                              spine_type='circle',
                              path=Path.unit_regular_polygon(num_vars))
                # unit_regular_polygon gives a polygon of radius 1 centered at
                # (0, 0) but we want a polygon of radius 0.5 centered at (0.5,
                # 0.5) in axes coordinates.
                spine.set_transform(Affine2D().scale(.5).translate(.5, .5)
                                    + self.transAxes)
                return {'polar': spine}
            else:
                raise ValueError("unknown value for 'frame': %s" % frame)

    register_projection(RadarAxes)
    return theta


# 데이터 준비
data = [['배터리', '초점', '화질', '렌즈', '용량'],
        ('사진 촬영', [
                    [4, 3.5, 4, 2, 3,],
                    [1.07, 5.95, 2.04, 1.05, 0.00,],
                  ]
        )]

# 축 개수 (5개)
N = len(data[0])

# 다각형 레이더 차트 생성
theta = radar_factory(N, frame='polygon')

# 차트의 축 레이블
spoke_labels = data.pop(0)
title, case_data = data[0]
fig, ax = plt.subplots(figsize=(5, 5), subplot_kw=dict(projection='radar'))
fig.subplots_adjust(top=0.85, bottom=0.05)
ax.set_rgrids([])

# 제목
ax.set_title(title,  position=(0.5, 1.1), ha='center', pad=40)

# 색상
colors = ['#FF9999', '#66B2FF']

# 데이터 플로팅
labels = ['A', 'B']
for i, d in enumerate(case_data):
    color = colors[i % len(colors)]  # 색상 지정
    label = labels[i]
    line = ax.plot(theta, d, color=color, label=label)  # 레이블을 label로 설정
    ax.fill(theta, d, color=color, alpha=0.25)

# 축 레이블
ax.set_varlabels(spoke_labels)

# 범례 추가
ax.legend(loc='upper right', bbox_to_anchor=(1.3, 1.1), title='Legend')

plt.show()
이 기사는 저작권자의 CC BY 4.0 라이센스를 따릅니다.